Your feedback is essential to our software development process, and we listened to you. Since the launch of Oasys Giraphe, we’ve been dedicated to ensuring it meets your needs and delivers a seamless graphing experience. Read on to find out how we’ve incorporated your feedback.
What is Giraphe?
In a significant leap forward for geotechnical data management, Giraphe is the dynamic graphing integration for Seequent’s OpenGround Geotechnical Information Management software. With a comprehensive and growing library of common geotechnical graphs, you can effortlessly connect to your OpenGround projects, browse and select required graphs and generate them with just a few clicks. Giraphe supports manual graph creation through custom queries, ensuring flexibility and precision. With on demand data updates and export capabilities, Giraphe is set to transform geotechnical graphing, contributing to the future of Geotechnical Engineering.
Go to the product page to find out more information.
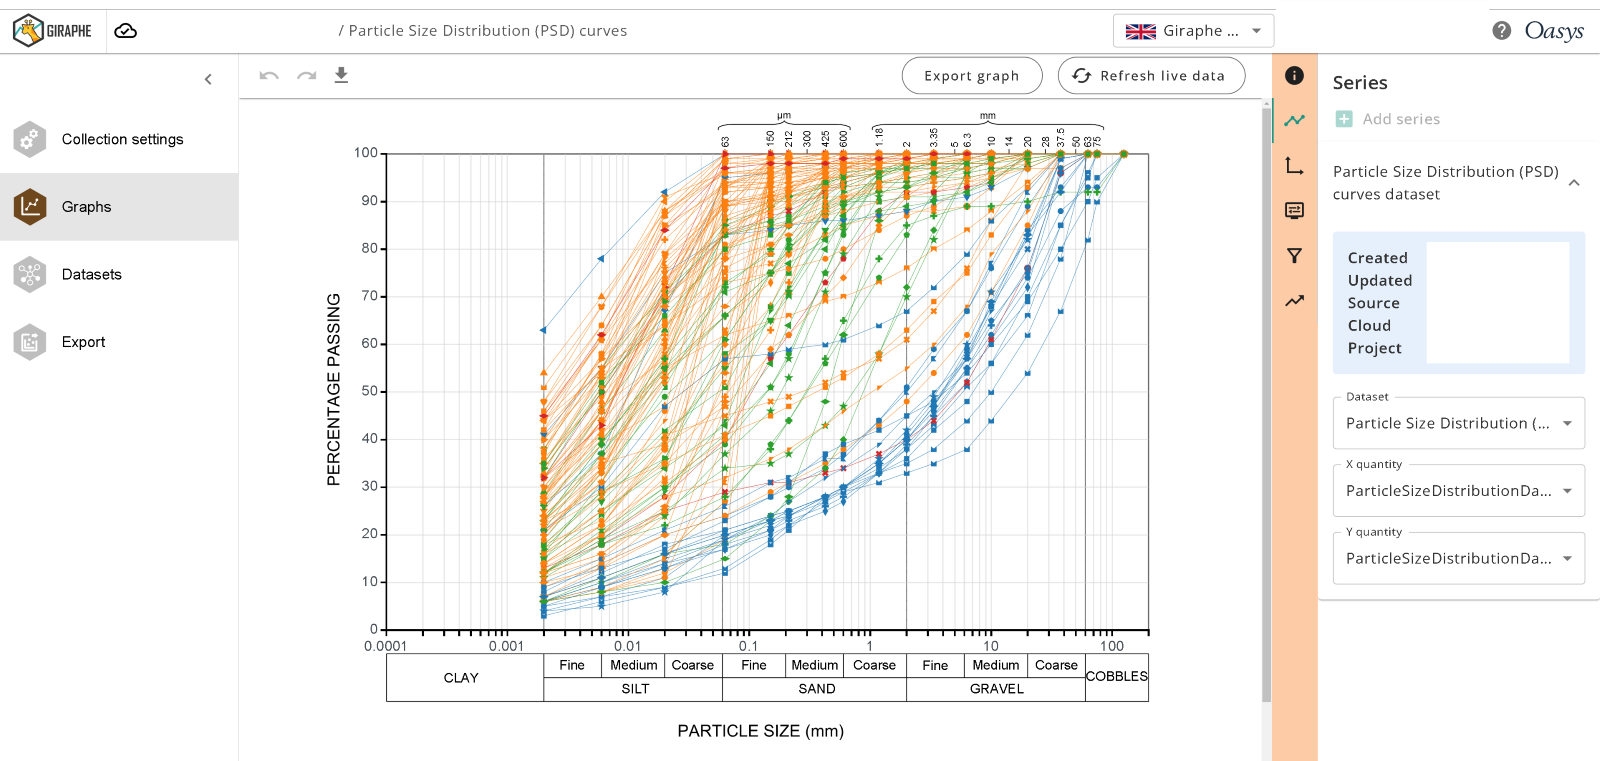
Explore the latest updates
We’ve conquered significant development milestones since Giraphe’s launch earlier this year. We listened to your feedback and made the necessary improvements to maximise your graphing experience.
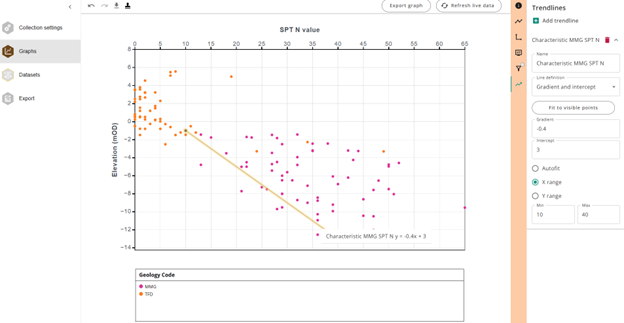
With the new trendline tool, you can now manually define trendlines between points using coordinate entry or by specifying a gradient and intercept.
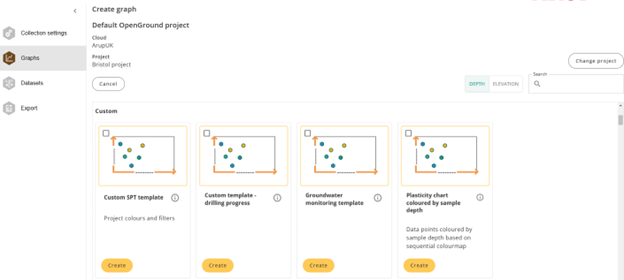
We’ve made multiple graph creation even more accessible to save you time and improve efficiency. You can now select multiple graphs from the library and create them all at once. We’ve also made it possible to multi-select graphs for deletion or refresh which streamlines data management within Giraphe. A wider range of colour palettes and symbols is now available, accommodating a much larger number of data points and enhancing visual clarity. Colour palettes can be set for a whole graph collection to ensure a cohesive feel or customised for each graph as needed.
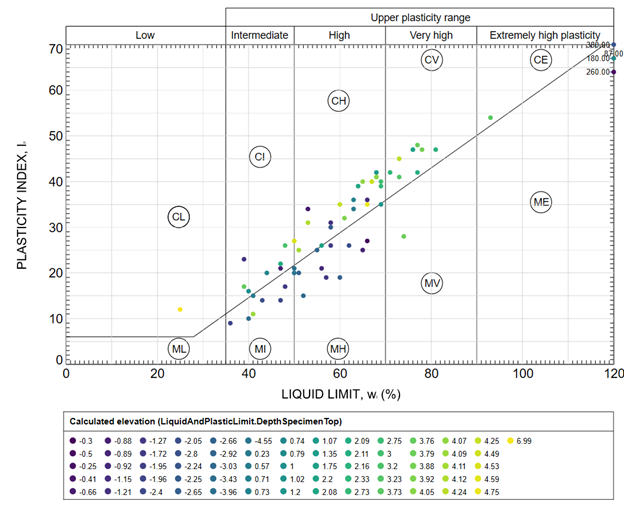
The graph library continues to grow with new templates and examples, providing you with more options for your projects.
Giraphe’s filtering capabilities have been greatly expanded. You can now filter graphs based on any combination of fields in your dataset, allowing you to interrogate your data as required. You can now save custom graphs as templates which will appear in your personal graph library for future use.
Collaboration with your colleagues has never been easier. Share collections of graphs with your team and assign either read-only or edit access.
How is Giraphe different to other graphing software?
- Seamless connection: Giraphe connects directly to OpenGround, eliminating the need for manual data transfers. Any changes in OpenGround are easily refreshed in Giraphe.
- Effortless graphing: The graph library includes a curated selection of common industry-standard geotechnical graphs, which can be quickly built using OpenGround project data and exported for inclusion in your reports and presentations.
- Powerful: Giraphe transforms graphs from a static format to interactive objects. You can highlight, hover, filter, and draw trendlines to better understand your data.
- Enhanced efficiency: Giraphe allows graphs to be reused across projects. Common groupings of graphs can be easily applied to new projects, saving time and effort.
- Collaborative: Collections of graphs can be shared with colleagues for collaboration, review, or reuse on other projects.
- User-friendly: Giraphe is designed to be intuitive and easy to use. Comprehensive documentation and videos are available to help new users get started quickly.
Go to the product page to learn more about Giraphe or register your interest.
To integrate Giraphe with OpenGround, i5 access is required. Make the switch to OpenGround today! Find out how to become a user.
Already an OpenGround user? Go straight to Giraphe to get started.
