This article was originally published on the Oasys website on the 31st May 2012. It has been updated and republished due to popularity. Authored by Peter Debney.
On Earth Day in 1990 they closed New York’s 42nd Street for the parade[1] and in 1999 one of the three main traffic tunnels in South Korea’s capital city was shut down for maintenance[2]. Bizarrely, despite both routes being heavily used for traffic, the result was not the predicted chaos and jams, instead the traffic flows improved in both cases. Inspired by their experience, Seoul’s city planners subsequently demolished a motorway leading into the heart of the city and experienced exactly the same strange result, with the added benefit of creating a 5-mile long, 1,000 acre park for the local inhabitants[3].
It is counter-intuitive that you can improve commuters’ travel times by reducing route options: after all planners normally want to improve things by adding routes. This paradox was first explored by Dietric Braess in 1968[4,5] where he explored the maths behind how adding route choices to a network can sometimes make everyone’s travel time worse.
To illustrate the paradox, let’s look at this simple four node network:
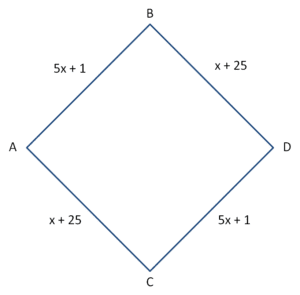
Where the time function for someone travelling on a route is affected by the volume of traffic (x) on each link. Thus the time to get from A to D is 6x + 26 minutes on both possible routes (A.B.D and A.C.D). As each route is equally attractive, the traffic will split half and half. If for example there were six commuters using the network, three will use each route making the travel time.
6*3+26 = 44 minutes
If we add a high-speed crosslink, we now have four possible routes:
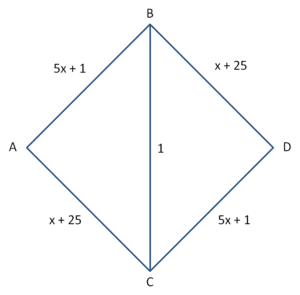
ABD, ACD, ABCD, ACBD
For the first traveller the best route is obviously ABCD, with a time of 13 minutes. The second will follow the same route but with a time of 23 minutes. For the third and fourth likewise follow the same routes with a times of 33 and 43 minutes. For the fifth and sixth the best routes are now either ABD or ACD, both with a time of 52 minutes. Thus while the extra high speed route was an improvement for the initial commuters, the overall effect has been to slow the network down by nearly 20%.
Rather than looking at each journey individually, the mathematician John Forbes Nash proposed that a network is in equilibrium when there is no advantage for any individual driver to choose a different route. This means that in a Nash Equilibrium all routes have the same travel time and the network can be solved using simultaneous equations.
To illustrate this let’s looks at another symmetrical example[6]:
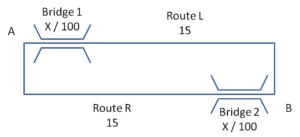
To get from A to B the travellers either go route L over Bridge 1 and then along a motorway, or route R along the other motorway and then over Bridge 2. The bridges are both subject to congestion such that the time (in minutes) to traverse them is the number of cars per hour divided by 100. The motorway sections always take 15 minutes. When the rush hour traffic has reached equilibrium, the time taken on both routes is the same. If we say that Lv is the traffic on route L and Rv the traffic on route R then
Lv/100 + 15 = 15 + Rv/100
If there are 1000 cars going from A to B then we know that
Lv + Rv = 1000
And thus we can see that
Lv = Rv = 500
Substituting back into the first equation we can see that the travel time for all drivers (Lt & Rt) is 20 minutes.
Again the authorities want to improve things by adding a high speed route, C, that only takes 7.5 minutes to travel on no matter what the level of traffic.
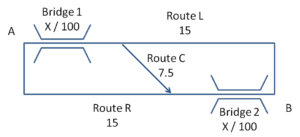
Let’s refer to the traffic that passes over bridge 1, then the new link, followed by bridge 2 as C. The steady-state travel times for the three routes (Lt, Rt, Ct) are now:
Lt = Rt = Ct => (Lv+Cv)/100 + 15 = (Lv+Cv)/100 + 7.5 + (Cv+Rv)/100 = 15 + (Cv+Rv)/100
Lv + Rv + Cv = 1000
From which we can calculate that Lv = Rv = 250 and Cv = 500. Thus the travel time on each of the routes is now 22.5 minutes and again the building of the new road has made the daily commute worse not better.
The common cause in both these networks is that originally there was a balance of two moderate choices, but the additional route was so much better that it attracted an excessive amount of traffic to the approach routes and thus imbalance the system.
The network does not have to be symmetrical to experience a Braess’ Paradox, such as in this example
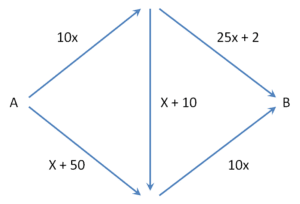
Braess Paradox might also manifest in other networks such as electronics or water supplies. It can certainly occur in structures as you will see in the video below:
Does adding a route choice always bring more congestion? Or to put it another way, does road building generate traffic? The answer is “not necessarily”. For example, one research project looked at routes through the city of Boston and found that of the 246 possible links on a journey between Harvard Square and Boston Common, closing one of six particular links did display the Braess Paradox of improving traffic flow, but closing one of the other 240 did make things worse[7,8].
This is fine in theory but can it be demonstrated in a MassMotion model? I built a model based on the second example and did indeed find that travel times doubled and congestion trebled by opening the link (i.e. deactivating the barrier). You can download it from here.

MassMotion model exhibiting the Braess paradox
So how can additions induce the Braess’ Paradox and how easy is it to spot one in action? Essentially they occur when an improvement attracts a disproportionate volume of traffic that the approaches cannot handle. If the induced congestion on these approaches affects other routes then the whole system suffers as a result. It should be obvious if you are running a MassMotion model before and after a change, but it is quite tricky to spot a rogue (or Braess) link in an existing model. Hagstrom and Abrams[9] have some mathematical methods for this, so it should make an interesting research project for one of our academic users to devise a technique to automatically spot the phenomenon in a MassMotion analysis.
So in conclusion, adding route choices to your network can improve flow through it, or it can make things worse, you just have to check…
References
[1] G. Kolata, “What if They Closed 42d Street and Nobody Noticed?”, New York Times, 1990, http://www.nytimes.com/1990/12/25/health/what-if-they-closed-42d-street-and-nobody-noticed.html
[2] J. Vidal, “Heart and soul of the city”, The Guardian, 2006, http://www.guardian.co.uk/environment/2006/nov/01/society.travelsenvironmentalimpact
[3] L. Baker, “Removing Roads and Traffic Lights Speeds Urban Travel”, Scientific American, 2009, http://www.scientificamerican.com/article.cfm?id=removing-roads-and-traffic-lights
[4] D. Braess, “Uber ein paradoxen der verkehrsplanung,” Unternehmenforschung, vol. 12, pp. 258-268, 1968, http://homepage.ruhr-uni-bochum.de/Dietrich.Braess/paradox.pdf
[5] D. Braess, A. Nagurney, T. Wakolbinger, “On a Paradox of Traffic Planning”, Transportation Science, vol. 39, No. 4, pp 446-450, 2005, http://homepage.rub.de/Dietrich.Braess/Paradox-BNW.pdf
[6] “The Braess Paradox”, http://vcp.med.harvard.edu/braess-paradox.html
[7] “Queuing conundrums”, 2008, http://www.economist.com/node/12202559
[8] H. Youn, M.T. Gastner, H. Jeong, “The Price of Anarchy in Transportation Networks: Efficiency and Optimality Control”, 2008, http://www.mendeley.com/research/price-of-anarchy-in-transportation-networks-ef-ciency-and-optimality-control/
[9] J.N. Hagstrom, R.A. Abrams, “Characterizing Braess’s Paradox for Traffic Networks”, http://tigger.uic.edu/~hagstrom/Research/Braess
